A Guide to Understanding the U.S. Caribbean Chapter of the NCA4
A Guide to Understanding the U.S. Caribbean Chapter of the NCA4
NCA4 Webinar Series – Chapter 20
Fourth National Climate Assessment (NCA4) Webinar Series
The Southeast CASC is hosting a six-part webinar series designed to help our partners and stakeholders in the Southeast more readily access the large amount of information synthesized in the Fourth National Climate Assessment Volume II (NCA4). We will highlight the key messages contained in the Southeast, Tribes & Indigenous Peoples, and U.S. Caribbean chapters of the NCA4, connect you directly to related elements of the volume, and make connections to relevant research, publications, and data from the Southeast CASC and others.
Below is a brief overview of this week’s webinar topic – Chapter 20:
The U.S. Caribbean
Tuesday, February 11, 2020, 12 pm ET
Presented by Bill Gould (Director, USDA Caribbean Climate Hub)
Figure Downloads from Chapter 20
Note that each figure on the NCA4 website has an eyeball icon associated with it that gives users access to detailed metadata. This can be used to recreate the figures and accurately portray the findings. Some figures have a gear icon that directs the reader to the Climate Resilience Toolkit, a powerful resource with hundreds of case studies and a Climate Explorer tool that allows users to explore dozens of climate parameters at the zip code level. In addition, we have created and linked pdf versions of each figure below for ease of saving the image with the associated legend.
Figure 20.1: U.S. Caribbean Region
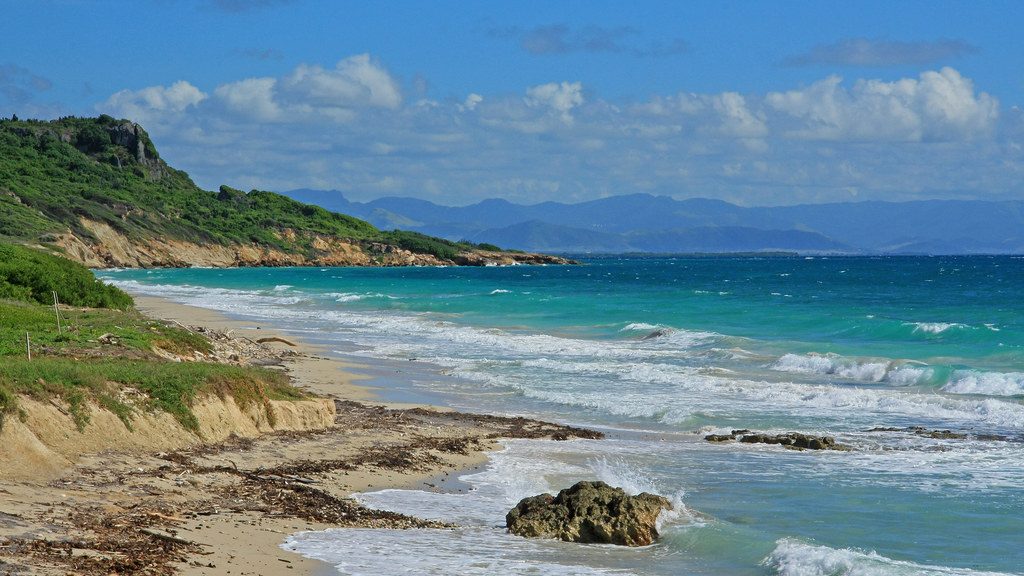
 Puerto Rico and the U.S. Virgin Islands (USVI) are rich in biodiversity, cultural heritage, and natural resources. More than 3.5 million inhabitants depend on the region’s natural resources and environmental services for their well-being, livelihoods, local economies, and cultural identities. Changing climate and weather patterns interacting with human activities, are affecting land use, air quality, and resource management and are posing growing risks to food security, the economy, culture, and ecosystems services.
(Link to Figure 20.1 | Downloadable PDF)
Figure 20.2: Climate Indicators and Impacts
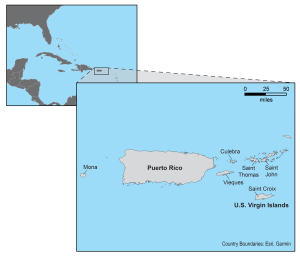
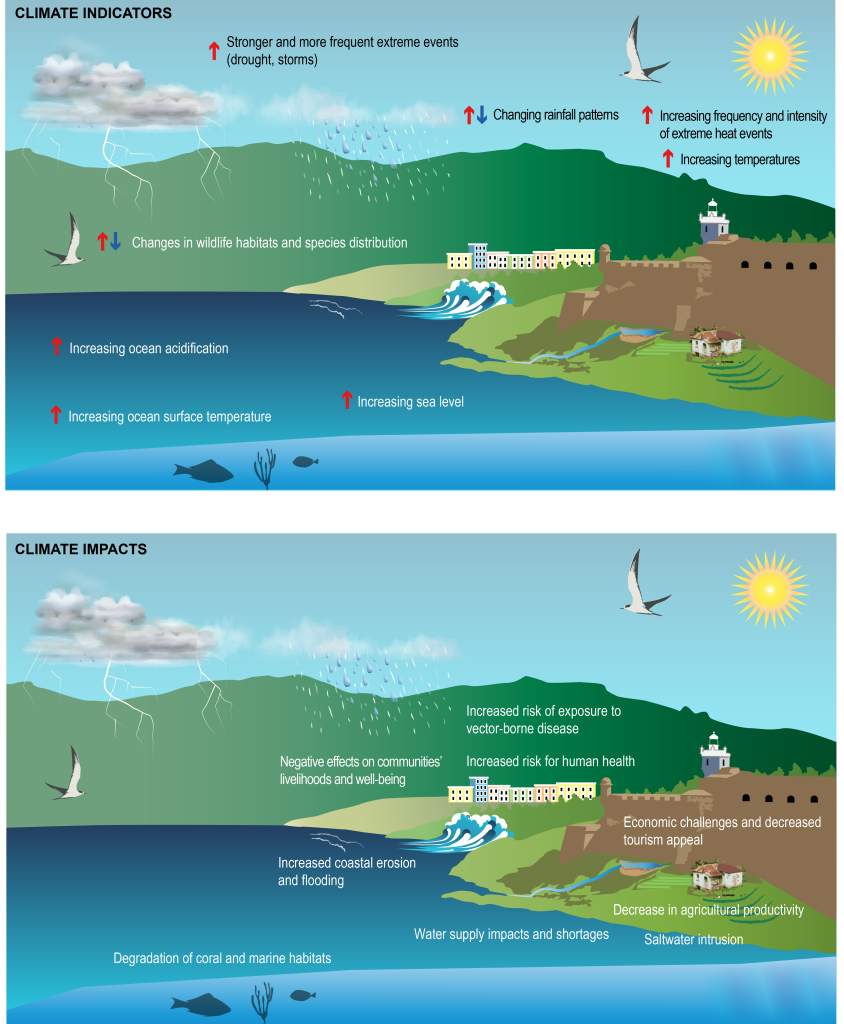 Figure 20.2: (top) Key indicators for monitoring climate variability and change in the U.S. Caribbean include sea level rise, ocean temperature and acidity, air temperature, rainfall patterns, frequency of extreme events, and changes in wildlife habitats. (bottom) Changes in these climate indicators result in environmental and social impacts to natural ecosystems, infrastructure, and society, including degradation of coral and marine habitats, increased coastal flooding and erosion, decrease in agricultural productivity, water supply shortages, negative effects on communities’ livelihoods and on human health, as well as economic challenges and decreased tourism appeal. Source: Puerto Rico Department of Natural and Environmental Resources.
(Link to Figure 20.2 | Downloadable PDF)
Figure 20.3: Observed and Projected Temperature Change for Puerto Rico
 Observed and projected temperature changes are shown as compared to the 1951–1980 average. Observed data are for 1950–2017, and the range of model simulations for the historical period is for 1950–2005. The range of projected temperature changes from global climate models is shown for 2006–2100 under a lower (RCP4.5) and a higher (RCP8.5) scenario. Projections from two regional climate models are shown for 2036–2065, and they align with those from global models for the same period. Sources: NOAA NCEI, CICS-NC, and USGS.
(Link to Figure 20.3 | Downloadable PDF)
Figure 20.4: Projected Precipitation Change for Puerto Rico
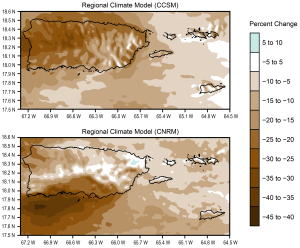 This figure shows the projected percent change in annual precipitation over the U.S. Caribbean region for the period 2040–2060 compared to 1985–2005 based on the results of two regional climate model simulations. These simulations downscale two global models for the higher scenario (RCP8.5) and show that within-island changes are projected to exceed a 10% reduction in annual rainfall. Uncertainty remains as to the location of the largest reductions within the islands. Projections of precipitation change for the U.S. Virgin Islands are particularly uncertain because of model limitations related to resolving these smaller islands. Source: Bowden et al. 2018.
(Link to Figure 20.4 | Downloadable PDF)
Figure 20.5: Ocean Chemistry and Temperature
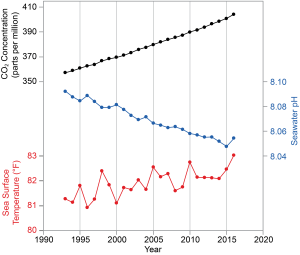 This figure represents an annual time series from 1993 to 2016 of atmospheric carbon dioxide (CO2; black line) , sea surface temperature (red line), and seawater pH (blue line) for the Caribbean region. The Caribbean ocean is subject to changes in surface pH and temperature due to the increase in atmospheric CO2 concentrations. The oceans have the capacity to not only absorb heat from the air (leading to ocean warming) but also to absorb some of the CO2 in the atmosphere, causing more acidic (lower pH) oceans. Continued ocean acidification and warming have potentially detrimental consequences for marine life and dependent coastal communities in the Caribbean islands. Source: University of Puerto Rico.
(Link to Figure 20.5 | Downloadable PDF)
Figure 20.6: Observed and Projected Sea Level Rise
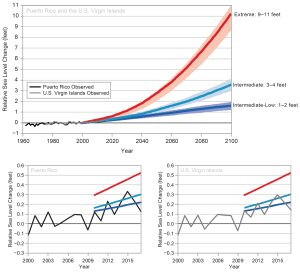 (top) Observed sea level rise trends in Puerto Rico and the U.S. Virgin Islands reflect an increase in sea level of about 0.08 inches (2.0 mm) per year for the period 1962–2017 for Puerto Rico and for 1975–2017 for the U.S. Virgin Islands. The bottom panels show a closer look at more recent trends from 2000 to 2017 that measure a rise in sea level of about 0.24 inches (6.0 mm) per year. Projections of sea level rise are shown under three different scenarios of Intermediate-Low (1–2 feet), Intermediate (3–4 feet), and Extreme (9–11 feet) sea level rise. The scenarios depict the range of future sea level rise based on factors such as global greenhouse gas emissions and the loss of glaciers and ice sheets. Sources: NOAA NCEI and CICS-NC.
(Link to Figure 20.6 | Downloadable PDF)
Key Message 1: Freshwater
Figure 20.7: Projected Change in Annual Streamflow
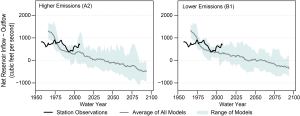 This figure shows ten-year moving averages of projected annual streamflow leaving Lago La Plata and Lago Loíza. Projections were developed using an estimation of water supply entering the reservoirs and an estimation of withdrawals. The former was developed using a range of global climate models (GCMs; shading indicates averages from all GCMs used in the study) and the mean of that range (gray line). The latter was developed using a conservative population growth rate. Annual streamflow is modeled under a higher emissions scenario (SRES A2; left panel) and a lower emissions scenario (SRES B1; right panel). The solid black line is the historical streamflow through 2012. It is important to note these are the best estimates available for projected streamflow and use the older generation of GCMs, which project more drying for the region. Source: adapted from Van Beusekom et al. 2016.
(Link to Figure 20.7 | Downloadable PDF)
Key Message 2: Marine Resources
“Marine ecological systems provide key ecosystem services such as commercial and recreational fisheries and coastal protection. These systems are threatened by changes in ocean surface temperature, ocean acidification, sea level rise, and changes in the frequency and intensity of storm events. Degradation of coral and other marine habitats can result in changes in the distribution of species that use these habitats and the loss of live coral cover, sponges, and other key species (very likely, high confidence). These changes will likely disrupt valuable ecosystem services, producing subsequent effects on Caribbean island economies (likely, medium confidence).”
Figure 20.9: Climate Change Effects on Coral Reefs
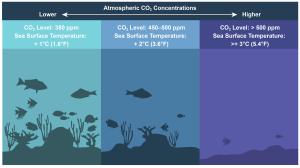 The diagram demonstrates how coral reef ecosystems in the U.S. Caribbean are likely to change in potentially warmer and more acidic waters caused by climate change, including elevated sea surface temperatures and elevated carbon dioxide (CO2) levels. The severity of these impacts increases as CO2 levels and sea surface temperatures rise. If conditions stabilized with concentrations of atmospheric CO2 at 380 ppm (parts per million), coral would continue to be carbonate accreting, meaning reefs would still form and have corals. At 450–500 ppm, reef erosion could exceed calcification, meaning that reef structure is likely to erode and coral cover is likely to decline dramatically. Beyond 500 ppm, corals are not expected to survive. Sources: NOAA and USFS.
(Link to Figure 20.9 | Downloadable PDF)
Figure 20.10: Climate Change Impacts on Coral Reef Ecosystems and Societal Implications
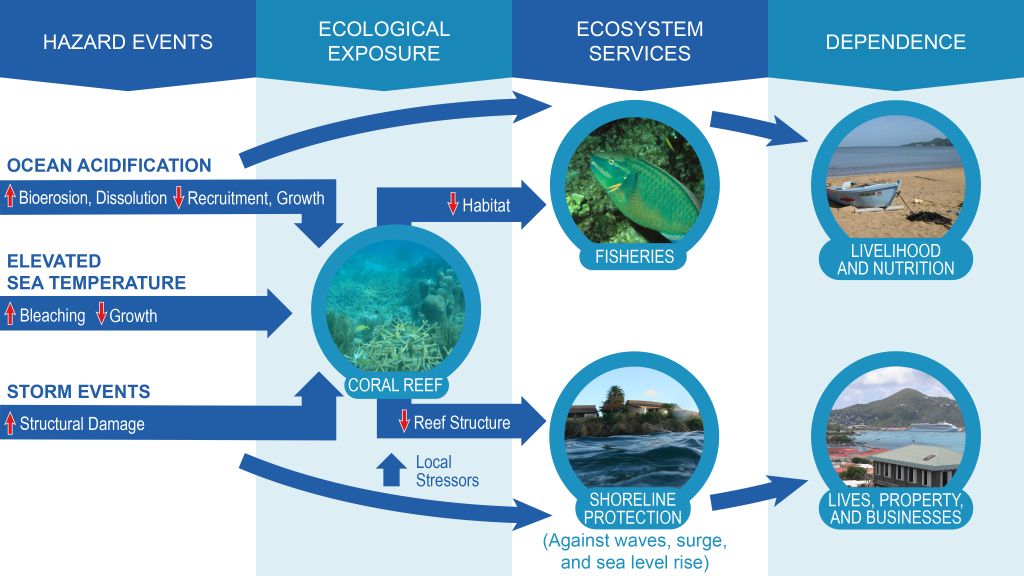 Figure 20.10: The figure shows the connections between climate-related impacts (ocean acidification and warming as well as severe storms), responses of marine habitats and species to these impacts, and, ultimately, the effects to ecosystem services (such as fisheries and shoreline protection) and, in turn, the human community. Specifically, the figure depicts how degradation of coral reefs due to climate change is expected to affect fisheries and the economies that depend on them as habitat is lost. The figure also shows how reef degradation decreases shoreline protection for local communities, which affects the economy and human populations more generally. Source: adapted from Pendleton et al. 2016.78. Photo credits: NOAA.
(Link to Figure 20.10 | Downloadable PDF)
Key Message 3: Coastal Systems
“Coasts are a central feature of Caribbean island communities. Coastal zones dominate island economies and are home to critical infrastructure, public and private property, cultural heritage, and natural ecological systems. Sea level rise, combined with stronger wave action and higher storm surges, will worsen coastal flooding and increase coastal erosion (very likely, very high confidence), likely leading to diminished beach area (likely, high confidence), loss of storm surge barriers (likely, high confidence), decreased tourism (likely, medium confidence), and negative effects on livelihoods and well-being (likely, medium confidence). Adaptive planning and nature-based strategies, combined with active community participation and traditional knowledge, are beginning to be deployed to reduce the risks of a changing climate.”
Coral Farming Can Increase the Extent and Diversity of Coral Reefs
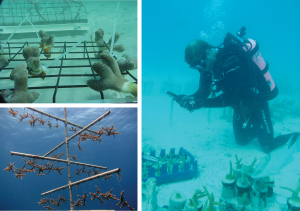 Examples of coral farming in the U.S. Caribbean and Florida demonstrate different types of structures used for growing fragments from branching corals. Coral farming is a strategy meant to improve the reef community and ecosystem function, including for fish species. The U.S Caribbean Islands, Florida, Hawai‘i, and the U.S.-Affiliated Pacific Islands face similar threats from coral bleaching and mortality due to warming ocean surface waters and ocean acidification. Degradation of coral reefs is expected to negatively affect fisheries and the economies that depend on them as habitat is lost in both regions. While coral farming may provide some targeted recovery, current knowledge and efforts are not nearly advanced enough to compensate for projected losses from bleaching and acidification. Photo credits: (top left) Carlos Pacheco, USFWS; (bottom left) NOAA; (right) Florida Fish and Wildlife (CC BY-ND 2.0).
(Downloadable PDF)
Key Message 4: Rising Temperatures
Figure 20.14: Days Above 90°F in Puerto Rico
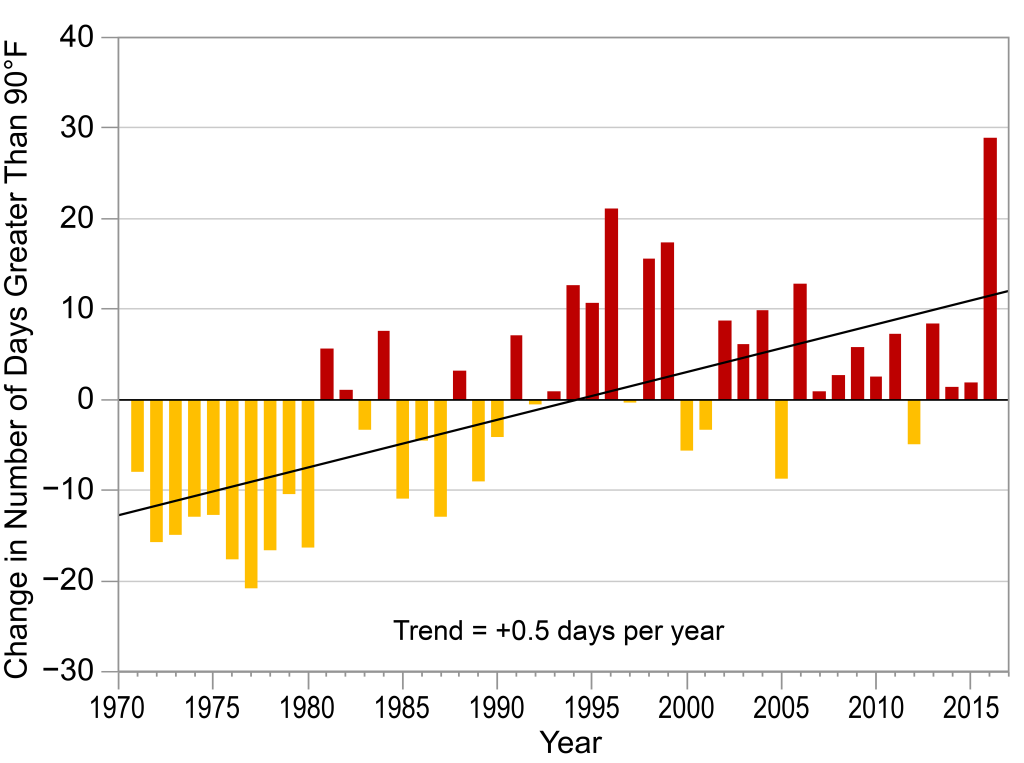 Figure 20.14: This figure illustrates the deviation from the long-term (1971–2016) average annual number of days exceeding 90°F, based on data from eight climate stations in Puerto Rico. Source: University of Puerto Rico.
(Link to Figure 20.14 | Downloadable PDF)
Key Message 5: Disaster Risk Response to Extreme Events
Figure 20.15: Hurricane Impacts in 2017
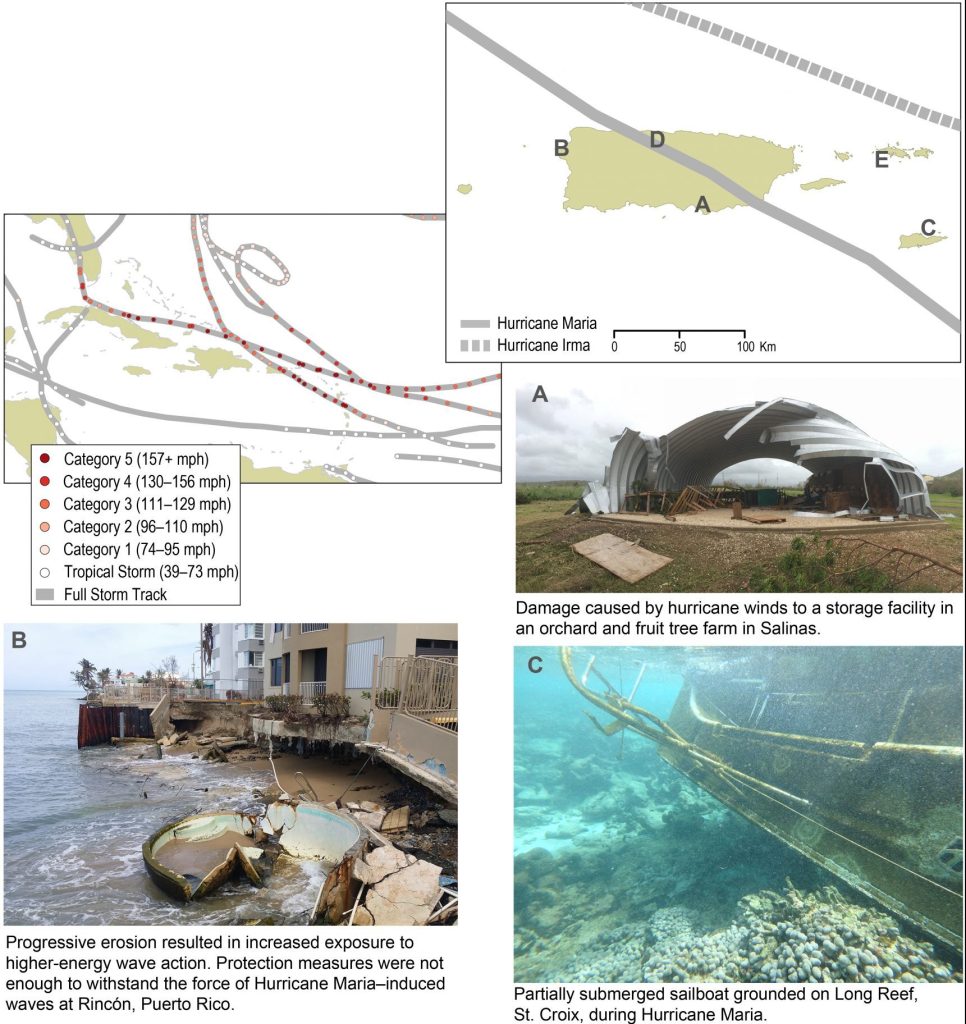 Figure 20.15: In September 2017, the U.S. Caribbean region was impacted by two major hurricanes: Irma (Category 5) and Maria (Categories 4 and 5). This figure shows the hurricanes’ tracks across both the Caribbean and the U.S. Caribbean region, as well as some of the impacts felt throughout the region. Sources: (tropical cyclone tracks) NOAA NCEI and ERT, Inc. Photo credits: (A) Ricardo Burgos; (B) Ernesto Díaz, Puerto Rico DNER; (C) Michael Doig, NOAA; (D) Joel Figuero; (E) Greg Guannel, The University of the Virgin Islands
(Link to Figure 20.15 | Downloadable PDF)
Figure 20.17: Maximum Extent of Drought
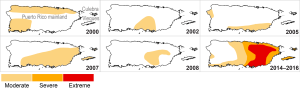 These maps show the maximum extent of each registered drought between 2000 and 2016 by the U.S. Drought Monitor. While six drought events were registered, the most severe of these occurred between 2014 and 2016, with extreme conditions covering the eastern half of the main island of Puerto Rico. The five events prior to 2014 were registered as moderate drought and were short-lived in comparison. Source: USDA Forest Service.
(Link to Figure 20.17 | Downloadable PDF)
Key Message 6: Increasing Adaptive Capacity Through Regional Collaboration
Figure 20.18: Climate Risk Management Organizations
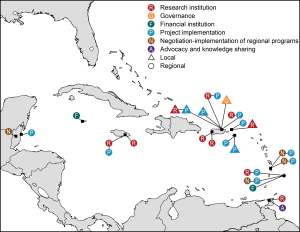 Some of the organizations working on climate risk assessment and management in the Caribbean are shown. Joint regional efforts to address climate challenges include the implementation of adaptation measures to reduce natural, social, and economic vulnerabilities, as well as actions to reduce greenhouse gas emissions. Sources: NOAA and the USDA Caribbean Climate Hub.
(Link to Figure 20.18 | Downloadable PDF)
Box 20.4: Collaboration and Tools for Cross-Country Capacity Building and Decision-Making
(Link to Box 20.4)
U.S. Caribbean Drought Workshop Fact Sheets
– Drought Impacts on Tropical Forest Ecosystems
– Drought Impacts on Coastal Estuary Ecosystems
– Drought Impacts on Freshwater Ecosystems
– Drought Impacts on Crops
– Drought Impacts on Livestock
– Full Workshop Report

Caribbean Oral Histories
Throughout the workshop, the Southeast CASC and North Carolina State University collected oral testimonies, documenting the personal experiences of participants with drought and other extreme weather events in the U.S. Caribbean. Access the Caribbean Oral History archive, including video interviews and transcripts here.
Additional Case Studies from the U.S. Climate Resilience Toolkit:
– Case Study: Aquifer Storage and Recovery: A Strategy for Long-Term Water Security in Puerto Rico
– Case Study: Assessing a Tropical Estuary’s Climate Change Risks
SE CASC Publications relevant to this Key Message from the SE CASC Publications Database include:
- Drought in the U.S. Caribbean: Impacts to freshwater ecosystems (2019)
- Toward a Resilience-Based Conservation Strategy for Wetlands in Puerto Rico: Meeting Challenges Posed by Environmental Change (2018)
- Downscaling future climate change projections over Puerto Rico using a non-hydrostatic atmospheric model (2018)
- The Sensitivity of WRF downscaled precipitation in Puerto Rico to Cumulus 2 Parameterization and Interior Grid Nudging (2016)
- Climate Change Implications for Tropical Islands: Interpolating and Interpreting Statistically Downscaled GCM Projections for Management and Planning (2016)
- Regional and large-scale influences on seasonal to interdecadal variability in Caribbean surface air temperature in CMIP5 simulations (2015)
SE CASC funding and researchers have implemented projects relevant to this Key Message:
- Modeling Future Temperature and Precipitation for Puerto Rico and the U.S. Caribbean. Project Details.
- Strategic Habitat Conservation and Adaptive Strategies for the Conservation of Coqui Frogs in Puerto Rico. Project Details.
- Climate Change Implications for the Conservation of Amphibians in Tropical Environments. Project Details.
- Categories: